Gather your employees' feedback on a regular basis and stay informed of the impacts that your initiatives have.
In today's ever-changing work environment, understanding your employees is critical. It's time to do away with the traditional annual survey. Your ability to listen and respond proactively to constant change is the key to the success of your company.
Have real-time visibility into the health of your organization
Use Science-Based Tools
Top features
Why should you choose this plan?
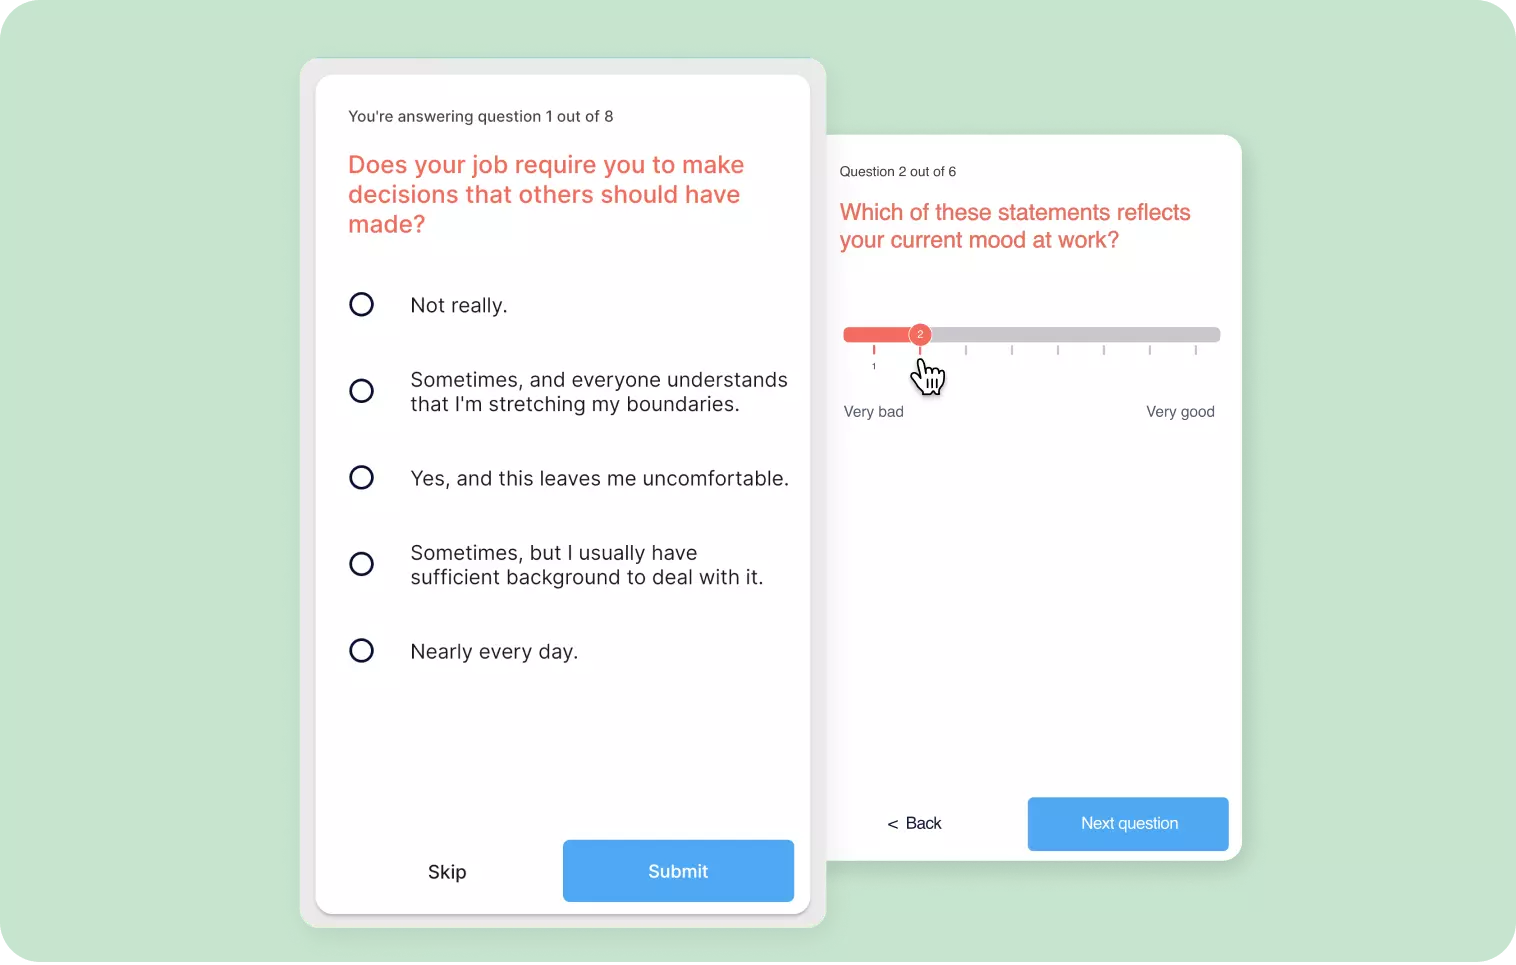
Recurrent questions with the Beaconforce algorithm
Beaconforce's question generator is powered by machine learning and a proprietary framework based on behavioral science and positive psychology. Our questions identify what motivated your people and their performance and whether these elements are present in their work environment.
Flow Chart
Beaconforce's flowchart helps companies detect and measure stress in real time at the team and individual level. Our flowchart lets you quickly identify teams and individuals who are at risk of burnout or who may be feeling like they're not reaching their full potential.
Executive Dashboard
The Executive Dashboard allows you to visualize data in a whole new way, allowing you to access insights from the data collected about your people each month. It's a dynamic dashboard, updated in real time, allowing you to view trends over time, historical graphs and manage, thus, changes based on real data.
Anonymous Feedback
With the Beaconforce platform every person in your organization can share thoughts, opinions or concerns with the company. Thanks to language processing, text analytics and computational linguistics we are able to analyze sentiment, with a positive or negative rating, and show within the executive dashboard the results in real time.
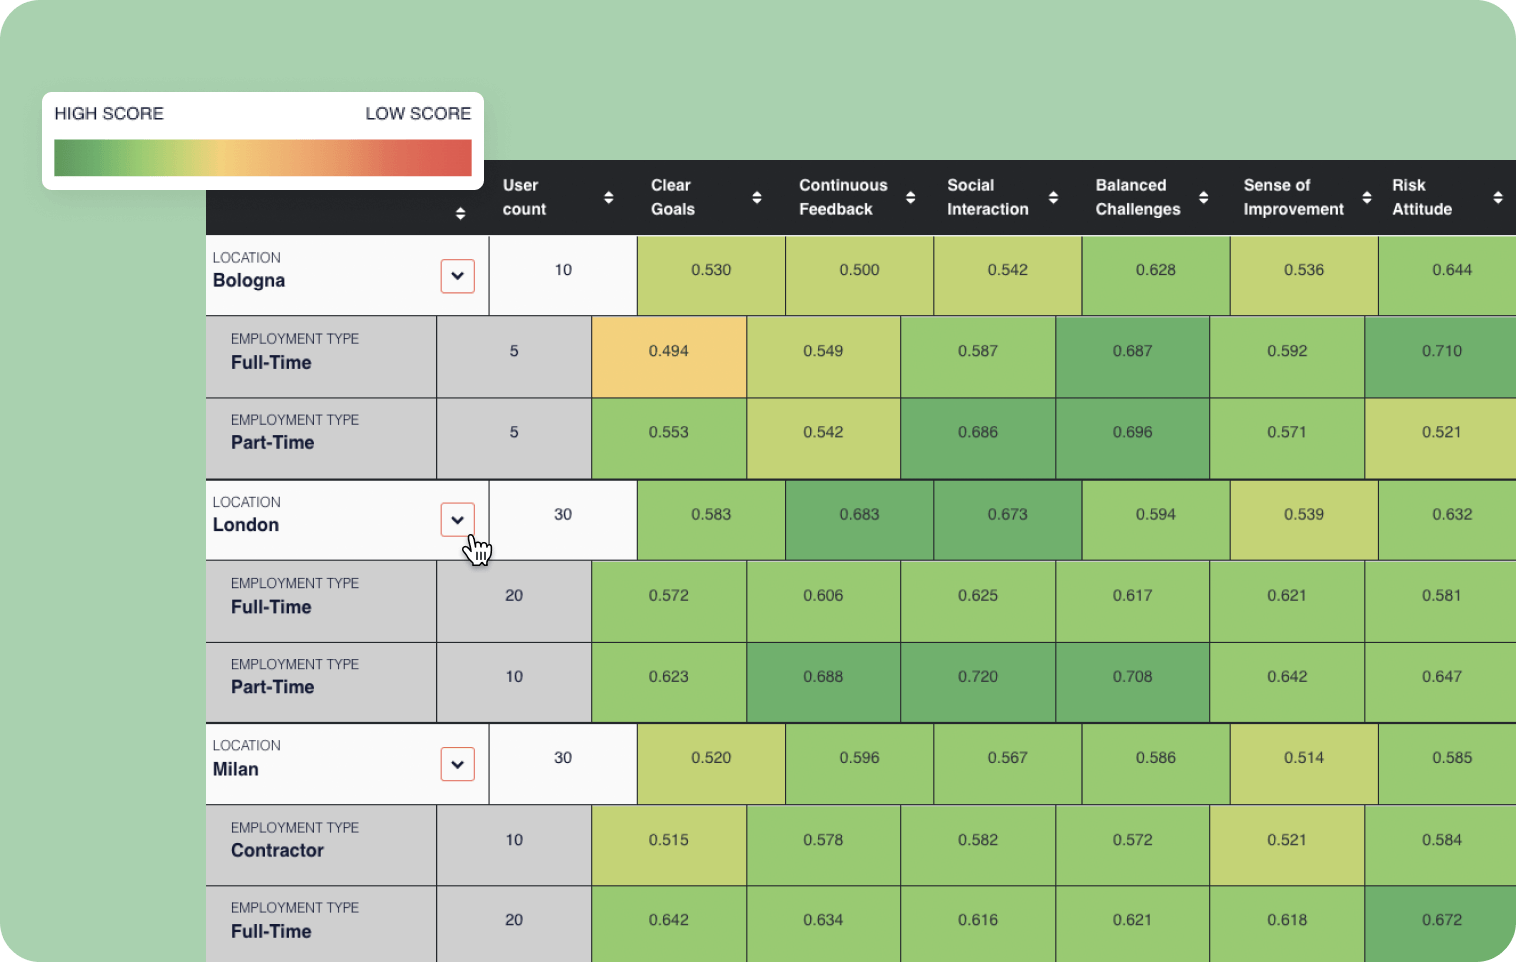
Dimension
In the Dimension section of the Beaconforce Executive Dashboard, it is possible, using a Heatmap, to analyze pillar and flowchart data by selecting previously configured filters. It is possible to cross examine up to two different types of filters at the same time. In this way you can create different combinations of results for deeper analysis of your data.
This plan includes all the features of the Light Pulse Plan.
Get the most out of your plan by adding features and tools
Get the most out of your plan by adding features and tools
Customize the platform by choosing your favorite theme and the welcome image and message your people will see on the platform.
Choice of Topics in Anonymous Feedback Submission.
Create a list of custom topics for your people to choose from when sending anonymous feedback. They will then be analyzed with Beaconforce's Sentiment Analysis software
Custom Filters for Graphs
Ability to analyze the data in the three charts in the executive dashboard by selecting one or more previously configured filters.